
How One Engineer Discovered Why Perfect Designs Fail in Production


The $47,000 Stool
Michael’s plastic stool design was flawless. Every dimension checked. Every radius perfect. The 3D renders looked production-ready. His client approved the design enthusiastically.
Then the first production run arrived.
Out of 5,000 stools, 1,847 had visible defects. Burn marks on corners. Sink marks on the seat surface. Some hadn’t filled completely—one entire leg was missing plastic. Several had cracked during shipping.
The cost: $47,000 in scrapped parts. The timeline: six weeks behind schedule. The client: threatening to cancel the contract.
Michael’s manager asked one question: “Did you run mold flow analysis?”
Michael had never heard of it.
That conversation changed Michael’s career. What he learned over the next two weeks wasn’t just about simulation software—it was about understanding the invisible journey of molten plastic through a mold cavity, and why parts that look perfect in CAD fail spectacularly in production.
This is the story of how mold flow analysis transformed Michael from a designer who created beautiful geometry into an engineer who created manufacturable products.
The Problem Nobody Sees
Here’s what Michael didn’t understand: Plastic injection molding isn’t like 3D printing. You can’t just pour plastic into a shape and expect it to work.
When molten plastic enters a mold at high pressure and temperature, it undergoes a complex physical transformation influenced by:
- Flow physics (how it moves through narrow passages)
- Heat transfer (how quickly it cools against cold mold walls)
- Material behavior (how the polymer chains orient and freeze)
- Pressure distribution (how forces propagate through the flowing plastic)
- Timing (what fills first, what fills last)
Michael’s stool looked perfect in SolidWorks. But he’d never asked: How will molten plastic actually fill this cavity?
His injection molding vendor had asked for “moldability analysis” before cutting the $85,000 tool. Michael said it wasn’t in the budget and pushed ahead. Now he was paying for that decision—literally.
The First Simulation: Fill Time
Michael’s manager pulled up SolidWorks Plastics and ran the first simulation: Fill Time Analysis.
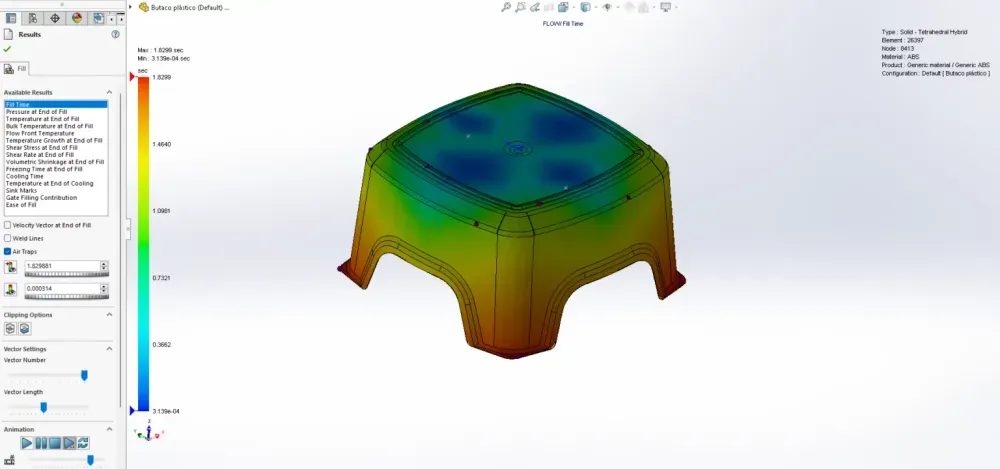
The stool appeared on screen with a color gradient flowing from blue to red, like a heat map showing time progression.
“Blue is where the flow starts—your injection location,” his manager explained, pointing to the center of the seat. “Red is where it ends—the extremities that fill last.”
The animation played: molten plastic flowed from the injection point in the center, spreading outward. But the flow pattern was alarming—the four corners filled significantly later than everything else.
Fill time range: 0.0001 seconds (center, blue) to 1.8299 seconds (corners, red)
“See these corners?” His manager pointed to the red regions. “They’re filling almost 2 seconds after the center started. That’s too long. By the time plastic reaches the corners, the plastic that entered first has started cooling. The flow front is sluggish. Pressure has dropped. You’re getting incomplete fills and burn marks from compressed trapped air.”
Michael remembered the production parts—the corners were exactly where defects appeared. Some corners hadn’t filled at all. Others had black burn marks.
“The fill time plot is predicting your exact production problem,” his manager said. “Before you cut a single tool.”
The Injection Location Revelation

“Where did you specify the injection location?” his manager asked.
Michael showed him: one gate, centered on the seat top surface.
“Seems logical,” his manager said. “Geometric center, right? But watch what happens if we move it.”
He ran three simulations with different injection locations:
- Center of seat (Michael’s design): Corners fill 1.8 seconds after center
- Edge of seat: One end fills fast, opposite end takes 2.4+ seconds
- Slightly offset from center: More balanced, corners fill within 1.2 seconds
“Injection location isn’t just about convenience for the molder. It fundamentally determines flow pattern, pressure requirements, and part quality.”
Michael learned the principles:
For uniform thickness parts: Place injection at the geometric center to create radial, balanced flow.
For long, thin parts: Inject at the center of length to minimize flow distance in both directions. Injecting from one end doubles flow length and pressure requirements.
For complex parts: Review fill time plots and adjust injection location until extremities fill simultaneously.
Michael’s stool needed the injection point slightly forward of geometric center to account for the thicker leg attachment points. This balanced the flow and reduced fill time variation from 1.8 seconds to 0.9 seconds—half the range, much more uniform.
The Air Trap Discovery
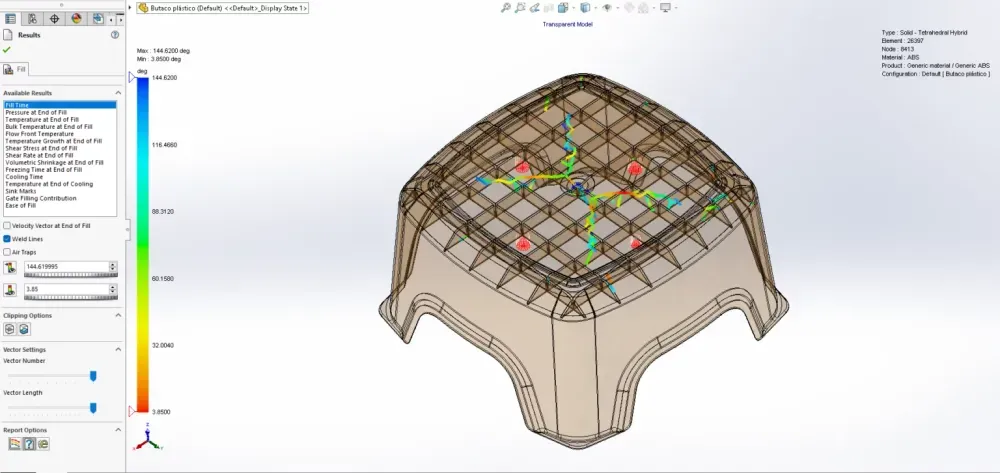
The next simulation revealed something terrifying: Air Traps.
Red dots appeared at specific locations—mostly in the corners where Michael’s production parts had burn marks.
“Air traps form where converging flow fronts squeeze air into pockets with no escape route,” his manager explained. “As more plastic enters the cavity, this trapped air compresses. Keep compressing it and it heats up—can reach over 500°C. Hot enough to ignite and create burn marks.”
He pulled up one of Michael’s defective production parts. Black scorch marks in the exact locations the simulation predicted air traps.
“In extreme cases, the igniting air can actually burn the mold surface—damage your $85,000 tool permanently.”
Solutions to air traps:
- Add parting line vents at trap locations (lets air escape)
- Use ejector pins as vents
- Add porous metal inserts that allow air out but not plastic
- Redesign geometry to eliminate converging flow fronts (best solution)
For Michael’s stool, adding small vent grooves at the corner air trap locations solved the problem. The simulation showed no more trapped air. The vent design went into the tool modification specs.
The Weld Line Warning
Next came a discovery that explained another production defect: Weld Lines.
The simulation showed lines appearing where two flow fronts merged—particularly around the leg attachment points and in corners.
“When two flow fronts meet, they don’t truly ‘weld’ like metal,” his manager explained. “The molecular chains from each front meet cold. The bond is weak—maybe 60-80% of the strength of surrounding material.”
He pulled up a production stool. Several had cracked during shipping—the cracks followed the exact weld line locations the simulation predicted.
“Weld lines create three problems:
- Structural weakness (stress concentrators, crack initiation points)
- Visual defects (visible lines on surface, different texture)
- Dimensional instability (different shrinkage across weld lines)”
Michael learned the harsh truth: You cannot eliminate weld lines. You can only control where they occur.
Weld lines are inevitable with:
- Through-holes (flow splits and rejoins)
- Multiple injection locations (fronts converge)
- Thickness variations (flow promotes or hesitates)
- Standing cores (flow diverts around obstacles)
“The goal isn’t elimination—it’s strategic placement. Put weld lines in non-critical areas. Never across primary load paths. Never on cosmetically critical surfaces.”
For the stool, Michael’s injection location created weld lines directly under the seat where users sit. The simulation let him relocate the injection point to move weld lines to the underside of legs—still present, but in non-critical locations.
The Pressure Problem
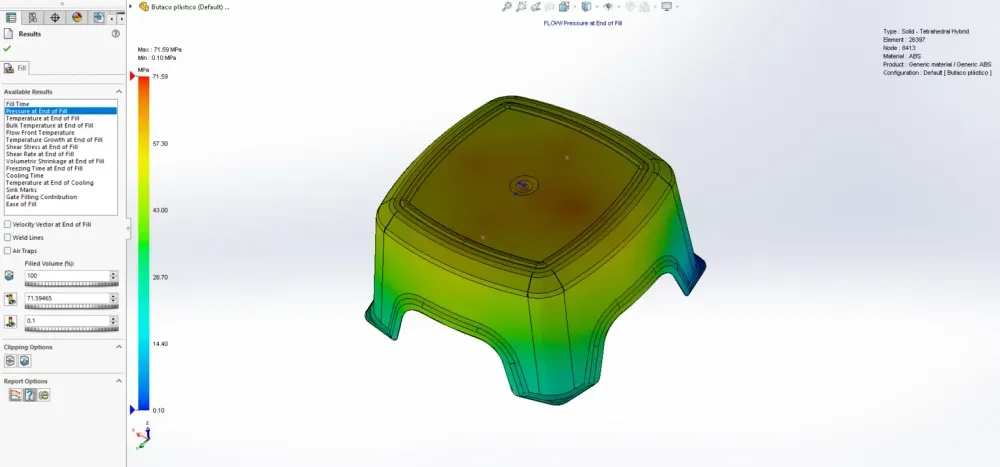
The Pressure at End of Fill simulation revealed why Michael’s molding vendor had struggled with consistent parts.
The pressure gradient showed:
- 71.35 MPa near injection location (green)
- 10.16 MPa at corners (blue)
“You’re losing 86% of injection pressure traveling from gate to corners,” his manager said. “That’s a massive pressure drop.”
Why pressure matters:
Injection pressure must overcome:
- Flow resistance through narrow passages
- Viscosity of molten plastic
- Friction against cavity walls
- Flow length distance
Factors increasing required pressure:
- Long flow lengths
- Thin walls
- High viscosity materials
- Cold molds
- Fast injection speeds
Michael’s stool had relatively thin walls (3mm nominal) and long flow lengths (200mm+ from center to corners). Combined, this required very high injection pressures—pressures the molding machine struggled to achieve consistently.
Some production runs filled fine. Others “short shot” (incomplete fills) when machine pressure maxed out before cavity was full.
The solution: Moving the injection location more centrally reduced maximum flow length from 200mm to 150mm—a 25% reduction. This dropped required injection pressure by nearly 40%, bringing it well within machine capability with comfortable margin.
The Temperature Story
Three temperature simulations revealed the thermal journey of Michael’s plastic:
1. Temperature at End of Fill
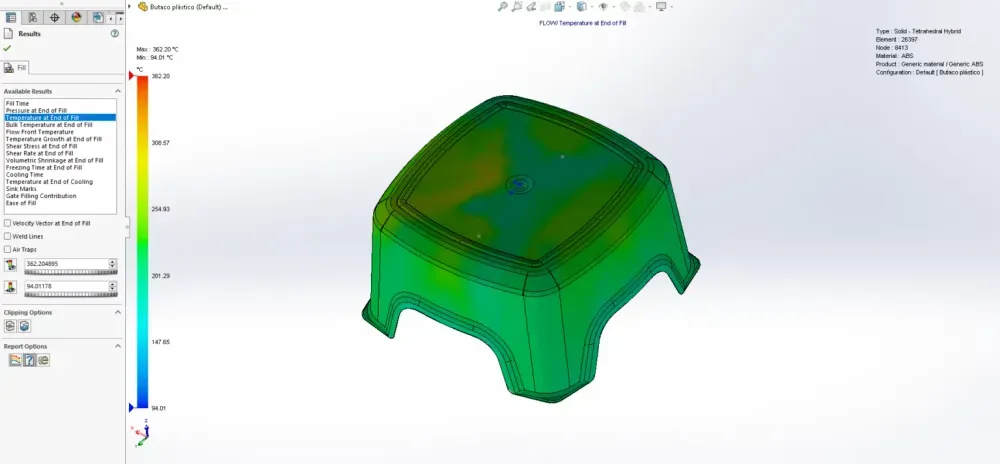
The stool showed mostly green (258°C) with thin blue layer at all surfaces.
“This blue layer is frozen plastic,” his manager explained. “It contacted the cold mold wall and instantly formed a frozen skin. This skin’s thickness depends on thermal conductivity and temperature differential—not part wall thickness.”
2. Bulk Temperature at End of Fill
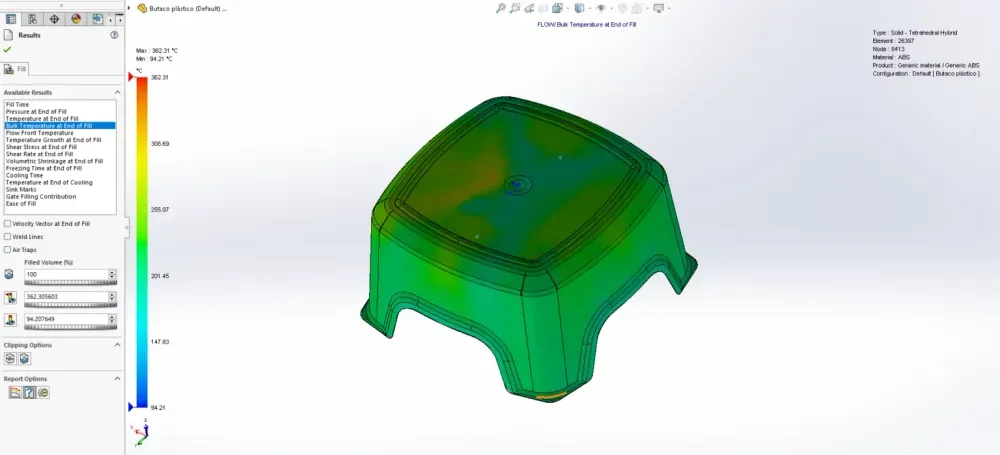
This showed how much the core plastic had cooled during filling.
Blue regions indicated stagnant plastic that cooled significantly. Red regions showed plastic that was still moving right before fill completed—it retained heat.
“Moving plastic generates shear heat and doesn’t have time to transfer heat to mold. Stagnant plastic cools. This is why flow rate matters—fill too slowly and plastic cools before the cavity fills.”
3. Temperature Growth at End of Fill
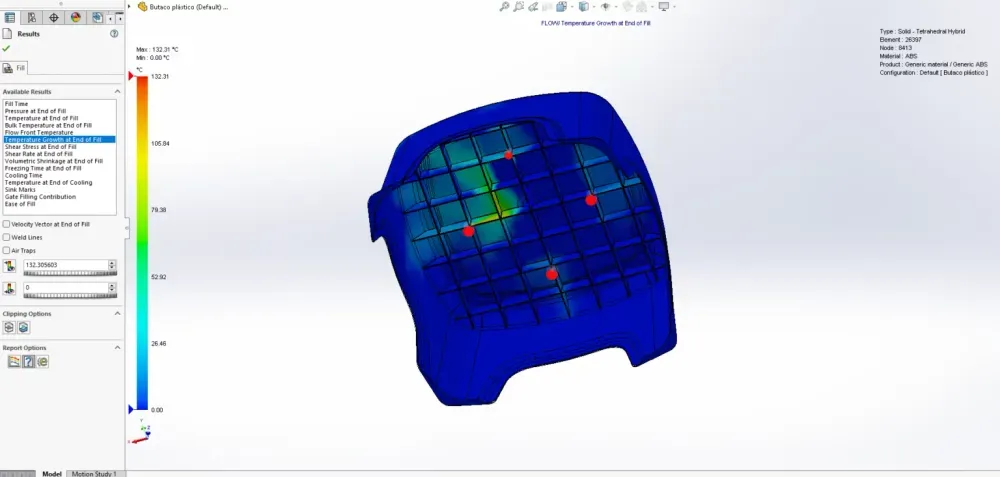
This one shocked Michael—portions of his stool showed temperature HIGHER than the set melt temperature.
“Shear heating,” his manager said. “When you force viscous plastic through narrow passages at high speed, friction generates heat. In extreme cases, plastic can overheat and degrade—burn marks, discoloration, weakened material.”
Michael’s stool showed shear heating of 132°C above melt temp in the gate area—dangerously high. The solution: slightly larger gate cross-section to reduce shear rates.
The Shear Story – Stress and Rate
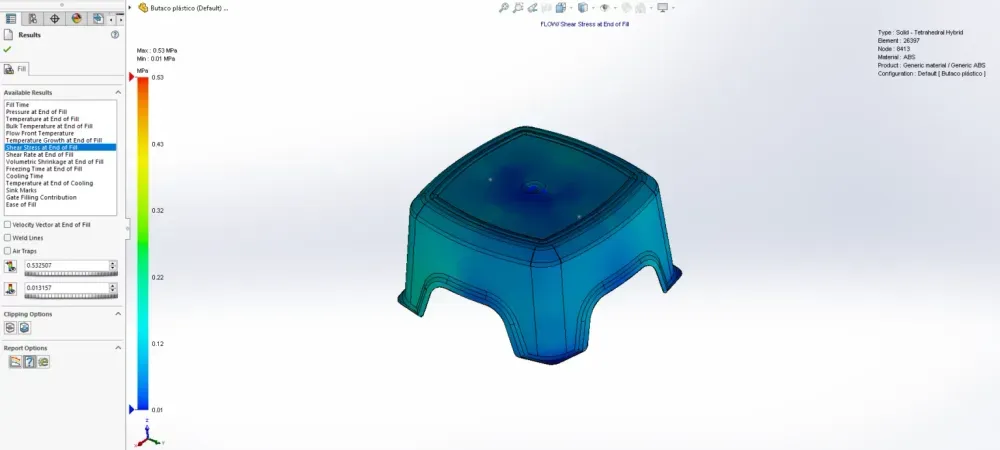
Two related simulations showed Shear Stress and Shear Rate—concepts Michael had heard in college but never really understood.
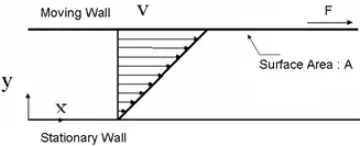
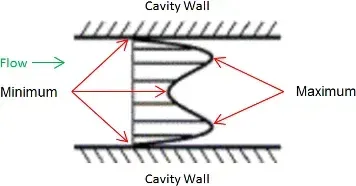
His manager showed him a diagram of plastic flowing through a cavity cross-section, illustrating how polymer chains move relative to each other:
- At the frozen wall: Zero velocity (frozen solid)
- Just inside the wall: Very high velocity differential = maximum shear
- At flow center: All chains moving together = minimum shear
“Imagine sliding playing cards across each other,” his manager demonstrated. “The cards in contact with the table don’t move. The cards just above slide over them. The cards in your hand move fastest. The shear is highest where stationary cards meet moving cards.”
Shear Rate: How fast adjacent layers of plastic are moving relative to each other
Shear Stress: The force required to make them move at different speeds

Why this matters:
- High shear rates generate heat (shear heating)
- High shear stress orients polymer chains in flow direction
- Polymer chain orientation creates anisotropic properties:
- Stronger in flow direction
- Weaker perpendicular to flow direction
- More shrinkage perpendicular to flow
“This is why thin-walled parts are stronger along their length than across their width,” his manager explained. “The chains aligned with flow direction.”
For structural parts, designers must account for this directional property difference. Load perpendicular to flow direction might require 50% thicker walls for equivalent strength.
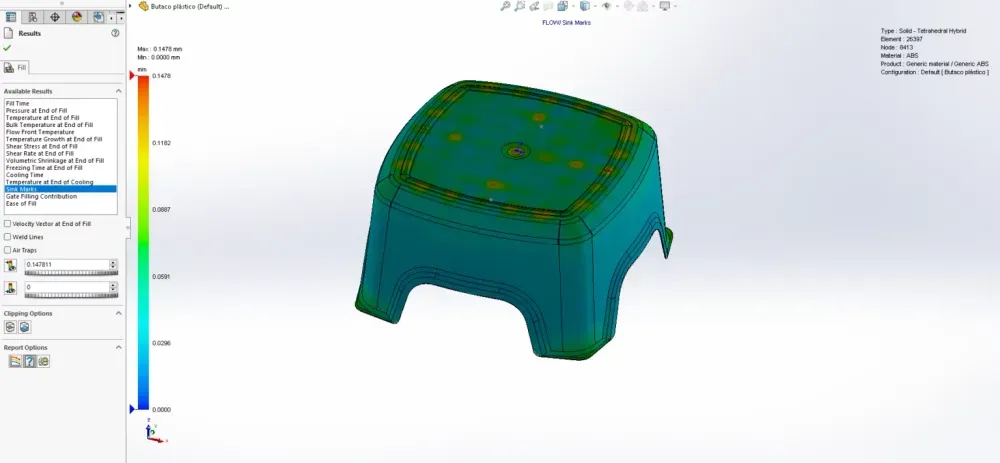
The Shrinkage Nightmare
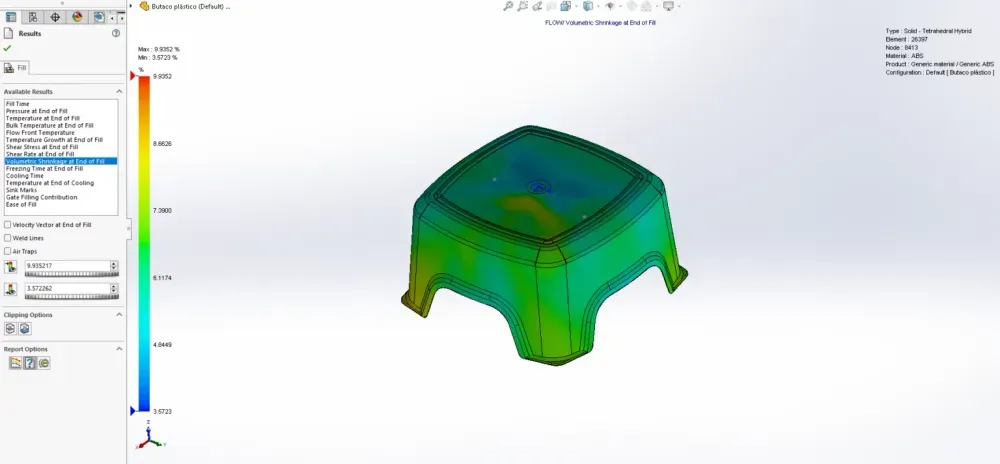
The Volumetric Shrinkage at End of Fill simulation showed yellow and red regions—high shrinkage zones.
“This predicts sink marks and internal voids,” his manager said, pointing to thick sections around leg attachment points.
He pulled up a production part. Visible depressions (sink marks) in the exact locations the simulation predicted high shrinkage.
“Here’s why sink marks form:
- Thick sections take longer to cool than thin sections
- Outer plastic cools first, forms rigid skin
- Core plastic still cooling, still shrinking
- Shrinking core pulls rigid skin inward
- Result: depression on surface = sink mark”
Sink marks appear because:
- Insufficient packing pressure
- Thick sections with long cooling times
- Plastic is a poor heat conductor (insulator)
- Core material keeps shrinking after surface solidifies
Michael’s design had boss attachments that were 100% of nominal wall thickness—guaranteed sink marks. The simulation confirmed it.
Design rules to prevent sink marks:
- Maintain uniform wall thickness (most important)
- Ribs and bosses should be 60-80% of nominal wall thickness
- Place injection locations at thickest sections (enables better packing)
- Avoid too-small gates (restrict packing pressure)
- Add core-out pockets to reduce thick sections
Michael redesigned the leg attachment bosses from 4.5mm to 3mm (67% of nominal wall). The sink mark prediction disappeared.
Freezing Time at End of Fill
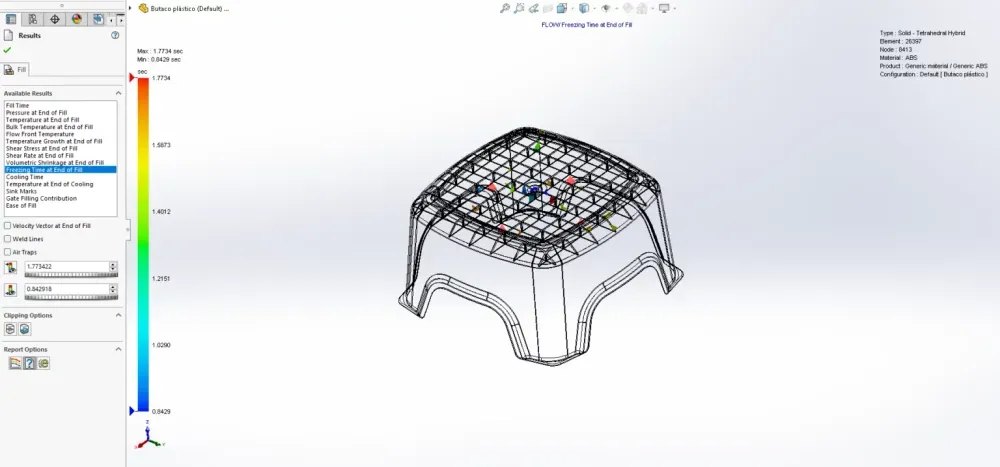
The freezing time scale used at the end of the filling process refers to the time it takes for the molten plastic material to cool down to its glass transition temperature. The time required depends on the difference in temperature between the melt and mold, as well as the thermal conductivity of both materials.
It’s important to note that cooling the part to its ejection temperature doesn’t necessarily require the material to be reduced to its glass transition temperature. The material’s deflection temperature under flexural load is what determines the ejection temperature. This temperature is typically around 2/3 of the material’s glass transition or melt temperature, measured in degrees Kelvin.
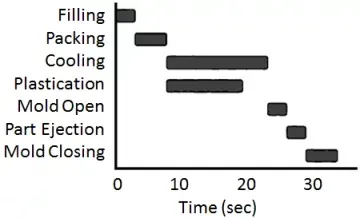
The Cooling Time Reality
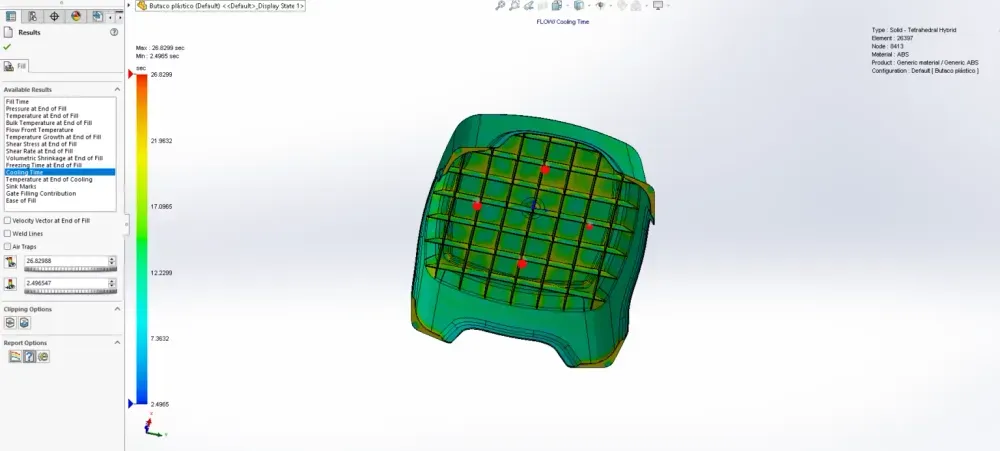
The Cooling Time simulation delivered brutal news: 26.4299 seconds.
“Cooling takes 70% of your cycle time,” his manager said. “For this stool, if total cycle time is 38 seconds, you’re spending 26 seconds just waiting for plastic to cool enough for ejection.”
Cooling time is proportional to the SQUARE of wall thickness.
Michael watched his manager demonstrate:
- 3mm wall: 26 seconds cooling
- 6mm wall (double thickness): 104 seconds cooling (4x longer!)
- 1.5mm wall (half thickness): 6.5 seconds cooling (1/4 time)
“This is why thin-wall design is economically critical. Doubling wall thickness quarters your productivity.”
Factors affecting cooling time:
- Wall thickness (primary driver—exponential impact)
- Melt temperature (higher = longer cooling)
- Mold temperature (higher = longer cooling)
- Material thermal properties (conductivity)
- Part complexity (uniform thickness cools faster)
Michael’s stool had thick sections taking 35+ seconds to reach ejection temperature while thin sections cooled in 18 seconds. The mold had to wait for the slowest region—wasted cycle time.
By making wall thickness more uniform (removing thick boss sections), average cooling time dropped to 22 seconds—a 17% productivity improvement. Over a 5,000-part production run, this saved 6+ hours of machine time.
The Temperature at End of Cooling
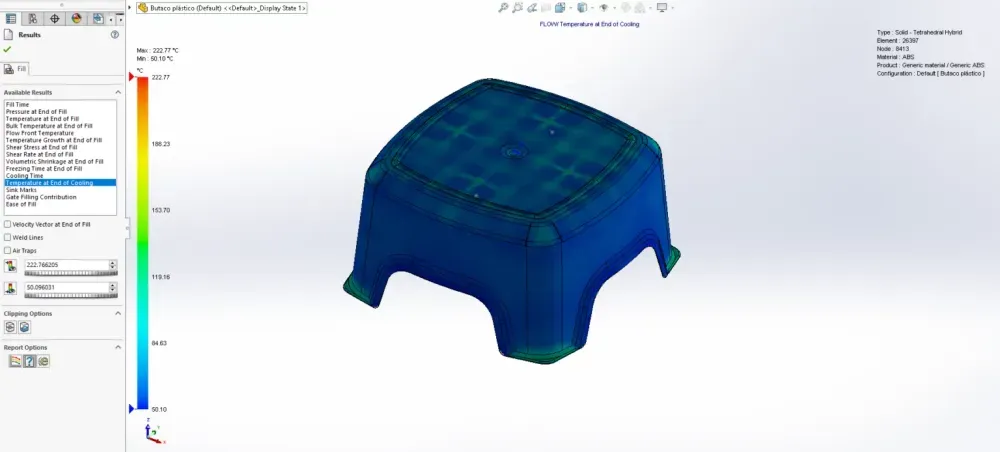
This simulation showed why some of Michael’s production stools warped after molding.
The plot showed most of the stool at proper ejection temperature (blue, ~90°C) but thick sections still at 150-170°C (yellow/red).
“When you eject a part with uneven temperature distribution, differential cooling continues after ejection,” his manager explained. “Hot sections shrink more than cold sections. Result: warpage.”
He showed Michael several warped production stools—twisted legs, bowed seats. All had thick sections that stayed hot too long.
The ejection temperature rule: Part can be ejected when 90% of volume reaches material deflection temperature under flexural load. This is typically 2/3 of glass transition or melt temperature (in Kelvin).
But if 10% of the part is still significantly hotter, problems occur:
- Differential shrinkage → warpage
- Hot spots too soft → deformation during ejection
- Thick sections → sink marks develop after ejection
- Internal stresses → potential cracking
Solution: Uniform wall thickness creates uniform cooling. Michael’s redesign brought temperature variation at ejection from 80°C range to 35°C range—much more uniform, minimal warpage risk.
The Ease of Fill Verdict
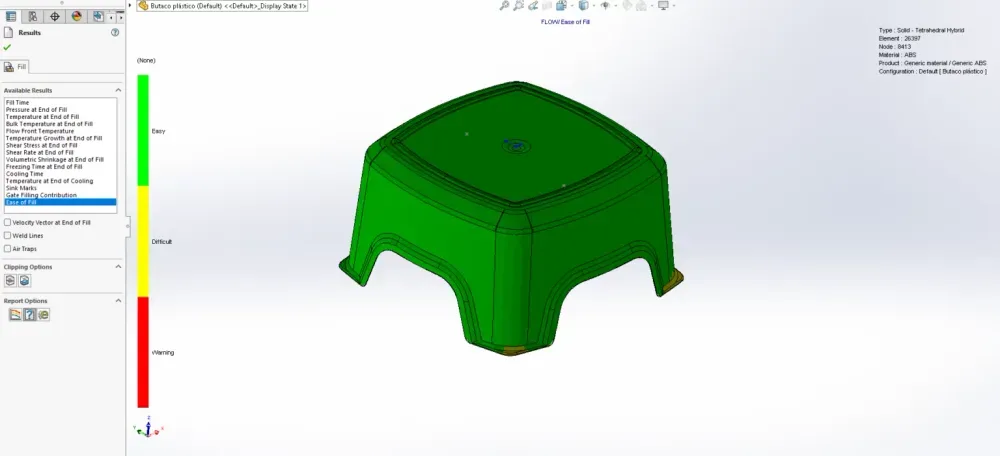
The final simulation was Ease of Fill—a simple go/no-go assessment.
Michael’s original design showed:
- Green areas: Normal injection pressure
- Yellow areas: 70%+ of maximum machine pressure
- Red areas: 85%+ of maximum machine pressure
About 30% of the stool showed yellow or red—dangerously high pressure requirements.
“Yellow means you’re pushing limits,” his manager said. “Red means you’ll have consistency problems. Some cycles will fill fine, others will short-shot depending on material variation, temperature fluctuation, machine wear.”
This explained perfectly why Michael’s production run had inconsistent results—they were operating at pressure limits where small variations caused failures.
Solutions for high pressure requirements:
- Increase wall thickness (reduces flow resistance)
- Change injection location (reduces flow length)
- Add injection locations (multiple gates)
- Change material (lower viscosity grade)
- Increase melt temperature (reduces viscosity)
- Increase mold temperature (reduces frozen layer thickness)
Michael’s redesign—better injection location, slightly larger gate, more uniform wall thickness—brought the entire part into green territory. Normal injection pressures, comfortable margins, consistent production.
The Second Tool: Success Story
Michael’s company authorized $12,000 to modify the existing tool based on simulation findings:
Changes implemented:
- Relocated injection point 15mm forward
- Enlarged gate from 2mm to 3mm diameter
- Added corner vents for air trap elimination
- Reduced boss thickness from 4.5mm to 3mm
Changes to part design:
- More uniform wall thickness throughout
- Ribs reduced to 2.4mm (60% of nominal 4mm)
- Thick sections cored out where possible
The modified tool arrived four weeks later. The test shots were perfect.
Next production run: 5,000 stools, zero defects, zero scrap.
Cost comparison:
- Original approach (no simulation): $47,000 in scrap + 6 weeks delay
- Simulation-driven approach: $2,500 simulation costs + $12,000 tool modifications
- Savings: $32,500 + avoided contract cancellation
But the real transformation:
Michael stopped designing parts in isolation. His new workflow:
- Design geometry in SolidWorks
- Run mold flow analysis (while geometry is still flexible)
- Identify problems before tool build
- Iterate design based on simulation
- Validate manufacturability
- Release to tooling with confidence
The 95% Error Elimination
Michael’s manager had mentioned this statistic: “We minimize manufacturing errors by 95% during the design phase.”
Michael now understood it wasn’t hyperbole. The simulation had predicted:
- Incomplete fills in corners ✓
- Burn marks from air traps ✓
- Weld line failures under load ✓
- Sink marks on surfaces ✓
- Warpage from uneven cooling ✓
- Pressure limitations causing inconsistency ✓
Every single production problem, predicted before cutting steel.
The cost to fix these issues:
- During simulation: Time to run analysis + design iteration time
- After tool build: Tool modification costs + production delays + scrap costs + potential customer loss
Michael’s production timeline evolution:
Project 1 (the stool disaster):
- Design: 2 weeks
- Tool build: 8 weeks
- First article: 2 weeks
- Discover problems: Day 1 of production
- Tool modification: 4 weeks
- Second article validation: 2 weeks
- Total: 18 weeks, $47K in scrap
Project 2 (with simulation):
- Design: 2 weeks
- Simulation & iteration: 1 week
- Tool build: 8 weeks
- First article: 2 weeks
- Production: Start immediately
- Total: 13 weeks, $0 scrap
5 weeks faster. $47,000 saved. Customer confidence maintained.
The Analysis Types Michael Now Uses
Michael’s standard plastic part development now includes:
Fill Analysis:
- Fill Time (flow pattern, balance)
- Injection Location optimization
- Air Trap identification
- Weld Line placement
- Pressure requirements
- Temperature distribution
Flow Analysis:
- Velocity vectors (fiber orientation prediction)
- Shear rates and stresses
- Bulk temperature evolution
- Frozen layer formation
Post-Fill Analysis:
- Volumetric shrinkage (sink mark prediction)
- Cooling time (cycle time estimation)
- Temperature at ejection
- Warpage potential
Manufacturability Analysis:
- Ease of Fill (pressure assessment)
- Gate location contribution
- Runner system optimization
For critical parts, Michael adds:
- Finite Element Analysis (structural validation)
- Material testing (mechanical properties)
- Failure analysis (if prototype issues arise)
The Hidden Benefits
Beyond defect elimination, Michael discovered other simulation benefits:
1. Material Selection Validation
He could test different materials virtually:
- ABS vs. Polypropylene vs. PC/ABS blends
- Different grades of same material
- Filled vs. unfilled variants
- Recycled content materials
The simulation showed how each material would flow, cool, and shrink—before buying expensive test batches.
2. Process Parameter Optimization
Test different:
- Injection speeds
- Packing pressures
- Mold temperatures
- Cooling times
Find optimal settings before production, not during expensive machine time.
3. Tool Design Validation
Work with toolmakers to:
- Optimize cooling channel placement
- Size runner systems correctly
- Place gates optimally
- Design venting strategy
4. Cost Reduction Opportunities
The simulation revealed:
- Walls could be thinner than designed (material savings)
- Faster cycle times possible (productivity gains)
- Simpler tooling adequate (capital savings)
- Single gate sufficient vs. multiple gates (tool cost reduction)
For one project, simulation showed Michael could reduce wall thickness from 4mm to 3mm with no structural compromise. Material savings: 25% per part. Over 50,000 part lifetime: $18,000 saved.
The Industry Impact
Michael’s company now requires mold flow analysis for all plastic parts before tool approval. The policy came after his stool project.
Results after 18 months:
- 23 new plastic parts designed
- Zero tool modifications required for moldability issues
- Average 4.2 design iterations per part (vs. 1.3 tool modifications previously)
- $340,000 in avoided scrap and rework
- 8 weeks faster average time-to-market
- Zero contract penalties for late delivery
The culture shift:
Engineers stopped thinking “Can I design this shape?” and started thinking “Can this shape be manufactured?”
Questions that became routine:
- “Where will the injection location be?”
- “How will plastic flow through this geometry?”
- “Will this create air traps?”
- “Where will weld lines form?”
- “Is wall thickness uniform enough?”
- “What will cooling time be?”
These questions surfaced during design reviews, not after tool build.
The Consultant’s Wisdom
Six months after the stool project, Michael attended a plastics conference. A veteran molding engineer gave a presentation that crystallized everything:
“Perfect geometry is not the goal. Manufacturable geometry is the goal.”
“I’ve seen beautiful designs that were impossible to mold. I’ve seen ugly designs that produced perfect parts consistently. Beauty doesn’t matter if you can’t make it.”
“Injection molding is physics. Physics doesn’t care about your deadlines or your budget. The plastic will flow according to physical laws. Your job as a designer is to work WITH those laws, not against them.”
“Simulation is not overhead. Simulation is insurance.”
“Would you build a bridge without structural analysis? Would you design a pressure vessel without stress analysis? Then why would you design a plastic part without mold flow analysis?”
“The time to discover problems is when fixing them costs nothing but computer time. Not when fixing them costs tool modifications and production delays.”
The Question Michael Now Asks
When new engineers join his team, Michael shows them his original defective stools—he keeps them as teaching tools.
Then he asks: “Can you see the problems?”
New engineers examine the parts. “The corners didn’t fill. There are burn marks. The surface has depressions. Some cracked.”
“Correct. Now, can you see the problems in this CAD model?”
He shows them the original SolidWorks file. It looks perfect. Clean geometry. Proper dimensions. Professional rendering.
“I can’t see any problems in the CAD,” they admit.
“Exactly. Because the problems aren’t geometric. They’re physical. The geometry doesn’t show how plastic will flow, cool, shrink, and solidify. You need simulation to reveal that.”
Then he shows them the simulation results predicting every defect before the tool was built.
“This is why we simulate. Not because it’s required. Not because it’s policy. But because plastic parts live or die based on physics we cannot see by looking at geometry.”
The Final Truth
Three years after his stool disaster, Michael presents at his company’s engineering summit. His presentation title: “The Most Expensive Education I Ever Received.”
His closing slide shows two numbers:
Cost of NOT using simulation:
- $47,000 (one project)
- 6 weeks delay
- Nearly lost major client
- Team morale damaged
- Credibility questioned
Cost of using simulation:
- $2,500 per project (analysis time)
- 1 week (iteration time)
- 95% fewer manufacturing problems
- Faster time-to-market
- Happy clients
- Confident teams
“The question isn’t whether you can afford to do mold flow analysis,” Michael concludes. “The question is whether you can afford NOT to.”
The audience: 47 engineers. The question afterward: “How do I get trained on this?”
The cultural transformation: Complete.
Have you discovered manufacturing problems after tool build that simulation could have predicted? What costly lessons taught you to analyze before fabricating? Share your stories in the comments—we all learn from each other’s expensive educations.
This article is part of our Engineering Design Excellence series, where we transform CAD models into manufacturable products through simulation, analysis, and hard-won wisdom.


